10 years of investment performance – Do you stay between the flags and catch the wave, or get dumped – your “Call”
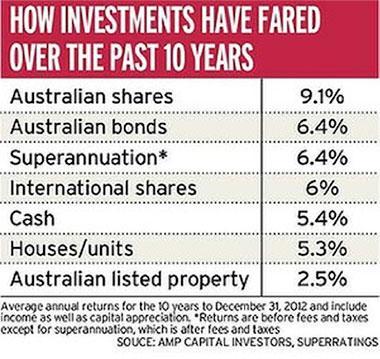
One article that caught my eye this week, being both a stock market and property investor was the relative investment performance of the major asset classes over the past decade. And fair go – a decade is really a decent slab of time to look back over, right?
As you can see from the table below, it hasn’t been all tea and cake out there from an investment performance perspective.
The good news is, and as we are obligated to say in any investment presentation, past performance is no guarantee of future performance, and looking at this table, you would be right to breathe a sigh of relief! More seriously, what we have been discussing, since the start of the year, has been where next for markets and what has been driving them.
Clearly, lower interest rates, with the RBA rate currently sitting on 3% is forcing investors to re-evaluate where to invest their hard earned cash. (Click here to read our news article about it.) The wave of money, for want of a better description, is hitting the market – it has been for 6 months now – and just look the ASX200 being up around 20% for the financial year to date. As such, the choices we have are; to catch on the wave and have the potential to be paid, or sit in the “white water” watching, and get dumped.
What do we mean by that – Current Trades….
Over recent weeks, we have looked at a broad range of trades. So let’s now take a look at something fairly conservative – meat and potatoes – investment portfolio staple, Telstra. Currently trading at $4.58, paying a fully franked dividend of 14cents (a touch over 3%) later this month.
Sound attractive, after all, the RBA base rate, is 3%pa right now?
Of course, you also have choices, should you buy the shares. For example, you could hold off selling calls. In anticipation of a run up in the stock pre dividend, and sell calls later in the month. This offers a little more upside, but also increases the risk a touch.
Alternatively, Sell a March (not February) $4.60 Call for around 5c, reducing your break even on the stock/adding to your overall return. Why March options? To help avoid early exercise, and you are looking at a gross return of 4.6%, including the dividend.
Bare in mind risk – in this case, you would be expecting the stock to fall by its dividend amount, once it goes ex Div.
So let’s consider this objectively, for a moment. The above strategies would have to appeal, given that they are generating solid returns over 6 weeks or so, and in reality, how risky would you consider a holding in Telstra, at its current levels?
Looking for more?
Now, while this may give you food for thought. Maybe for those with a more adventurous appetite, my current FMG position has given me a ripe opportunity. I am in stock for $4.68. And today, the $5.00 March calls were offering 18.5c. That is a whopping 10.8% gross total return on exercise. For 7 weeks, or 4% gross on the option income alone. How many times a year would you really need to do that. In order to move closer to your financial goals?
Every day, we are identifying and trading these opportunities. Both here in Australia and on the US market. And we would love for you to join us.
Make sure you catch this wave. And don’t get sucked down in the white water because this is happening right now! To find out how we do this now is FREE of charge – click here and let us show you.

