Emotions are the key driver of the stock market. Yes, fundamentals and economics are the “Why” prices will rise or fall. But Fear and Greed are here and now actions that cause prices to fluctuate despite the underlying factors of a company, commodity, or market. Hence, the reason why Technical Analysis has become such a prized and popular method in modern day investing.
It’s not a market crash that causes investors to lose their wealth. Ok, so a 30% fall in the markets within a few days wipes out tens of Billions of dollars in value. But unless you sell stock and exit the position/s, you have an unrealized loss due to the crash. And in most “Flash Crash” situations, the markets rebound very quickly, resulting in stock positions bouncing back to previous crash levels. If not within weeks, then within a couple of months.
What loses wealth for stock market investors is holding onto stocks during an extended Bear market. And then selling at the bottom. Markets move in cycles, even though over the long-term they trend upwards, there are periods where a weak economic outlook results in falling stock values. This can result in long periods of time where the stock market declines, or at times, produce quick market crashes where fear drives selling pressure.
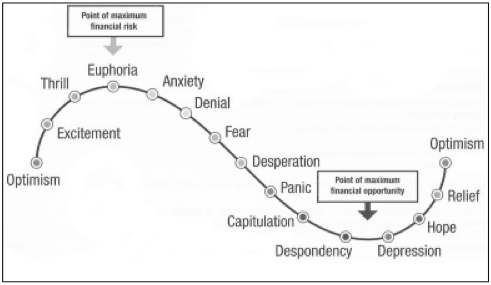
 Studies of emotional reactions to market cycles have been conducted for decades. The attached image depicts the typical emotional rollercoaster ride that investors go through. Pay particular attention to the emotions whilst the markets are falling. Fear, Desperation, and Panic are the usual reactions after stock markets have plummeted. And the investor has seen their stock values declining at a rapid rate.
The average investor doesn’t realize that there are warning signals at the top of a market prior to a major crash. We can take a look at any of the key panic periods. And note that the markets had topped well before the actual event. The following table shows some of the key statistics:
|
Date of Crash |
Market Peak – S&P500 |
Lead time before Crash |
Estimated market fall |
Difference from peak to start of crash |
|
August 2011 – European Financial Crisis |
7 July @ 1,356 |
1-month |
13% over 5-days |
5% |
|
Sept 16, 2008 – US Global Financial Crisis |
11th October 2007 @ 1,576 |
12-months |
25% over 6-days |
30% |
|
2000 Dotcom Bubble |
24th march 2000 @ 1,552 |
3-weeks |
10.7% over 3-days |
3.3% |
|
1987 Market crash – Black Monday |
~ 338 in late August 1987 |
~ 2-months |
20.5% in 1-day |
10% |
In the last 28 years, the largest Bear market situations we have experienced were from 2000 to 2003. And then 2007 to 2009. The following chart shows the S&P500 index from 1984 to November 2012. The index is the black line, with a 50-day moving average in red. And a 200-day moving average in blue.

It’s interesting to note that the severity of the 1987 stock market crash. To the left of the chart, now only appears to be a minor glitch in the grand scheme of things.
But back to why I don’t fear a Bear market.
There is one simple tool that I use to define the difference between a long-term Bull and Bear market – the Double Moving Average Crossover, set at 50 & 200-days. With the above chart set at Weekly. There have been only 24 crossings since 1984, highlighting 11 Bearish alerts. Although only 3 of these captured significant downwards shifts, the average movement of those 3 significant declines equates to 21.7% compared to the average failed Bearish alert of -8.8% (based on bullish and bearish crosses of the moving averages). This proves that it is very worthwhile adhering to this as a Rule to close investment positions and Short the market on a bearish crossing.
I’ve provided a copy of the raw data at the bottom of this article.
The real key is that the 50/200 daily MA cross provided successful alerts for the two key Bear markets. Resulting in significant shifts before the moving averages again crossed for a reversal in trend. This approach is a very simple combination. And can be optimised to provide clearer and more specific indications on strength of movement using broader Technical Analysis techniques.
So the fact is that by adopting a simple rule that has proven results means 1) we can avoid a large Bear market, 2) in most cases we have an alert ahead of the actual ‘market crash’, and 3) we can adopt the appropriate strategy to profit from a fall in the markets, outperforming the average investor.
Whether or not we have a Bear market around the corner is not a concern for me. When we have a Bearish cross of the 50/200 day moving averages, is when I will take action. As the probability is that this alert will result in a significant fall. And if not, I can always get back into the market anyway.

Matt Brown
US Stocks & Options Client Advisor
Halifax Investment Services
ASIC Australian Financial Services License Number – 225973
Matt Brown is a US Stocks and Options client advisor with Halifax Investment Services. He is an Authorised Representative of Halifax Investment Services with qualifications to provide General Advice in Derivatives and Stocks. He has worked in the Financial Industry since 1998, is a qualified Technical Analyst and has Accreditation as a Derivatives Advisor Level 1 & 2.